


The timeframe you trade on determines how often you receive signals, how much noise you encounter, and how quickly you must make decisions. Some traders thrive on fast 1-minute charts, while others perform better on calmer 15-minute or 1-hour charts.
In this guide, we'll break down what trading timeframes are, how shorter and longer charts differ, how multi-timeframe analysis works, and how to choose the timeframe that best matches your strategy and personality.
What are Timeframes in Trading?
Timeframes refer to the intervals that traders use to monitor price movements displayed on the charts. Timeframe ranges from a day to an hour, minutes, or seconds, and some even go for monthly to yearly time frames. In simple terms, how closely you examine price action on the charts is your time frame. Traders simply pick the best timeframe that aligns with their trading strategy.
Choosing the Right time frame
Time frame gives you an insight into price actions. Each trader can decide to choose the best timeframe that suits their trading style. For some, 1 minute or 5 minutes works best, so they monitor price actions closely within this time frame. Some choose weekly or daily time frames. While some choose to check price action on their trades monthly or yearly.
However, depending on the trading style, each has its pros and cons, and nothing is set in stone. Whether you are going for a shorter time frame or a longer time frame, the important thing is to choose the best one that fits your trading style. Do these before choosing a time frame:
- Determine what your trading style and strategy are; are you a scalper, day trader, or swing trader?
- Check how available are you are to monitor price movements?
- Determine your risk tolerance
- Demo across multiple charts, don't assume one is best
- Track your stress & rule adherence, note when you panic or overtrade
- Measure consistency, look at profits, losses, and emotional reactions
- If the time frame is not working, adjust before switching strategy. The right timeframe makes strategies more effective
The Difference Between Shorter Time Frames And Longer Time Frames
Choosing the right timeframe is an important part of building a trading strategy. Different timeframes reveal different layers of market behavior. Shorter timeframes show detailed price movements and frequent signals, while longer timeframes help filter out market noise and reveal the true trend direction. Understanding how each timeframe behaves helps you plan better entries, exits, and risk management.
Here's a clear comparison:
| Shorter Timeframes | Longer Timeframes |
|---|---|
| Zoom in on detailed price action and short-term trends | Filter out market noise and reveal the broader trend |
| More trading signals, but often less reliable due to noise | Fewer signals, but stronger reliability |
| Useful for precise entries and tight stop-loss placement | Better for spotting fading or maturing trends |
| Fast-moving, requiring quick reactions | Slower-moving, easier to analyze calmly |
| Constant attention and rapid decision-making | More time to plan trades and manage risk |
| Can trigger early stop-outs from minor fluctuation | Reflects sustained moves with stronger follow-through |
This difference in timeframes also affects how chart patterns like the double top and double bottom play out. On shorter timeframes, these patterns appear more often because of minor price swings, but many of them are false signals that quickly reverse and stop traders out. On longer timeframes, however, double tops and bottoms are rarer and far more reliable, often marking major turning points in the market with stronger follow-through. This is why choosing the right timeframe is not just about personality, as it directly impacts how patterns behave, how signals are interpreted, and ultimately how effective your trading strategy becomes.
Read More: Best Time to Buy and Sell Stocks: The Strategy That Works
Multi-time frame approach
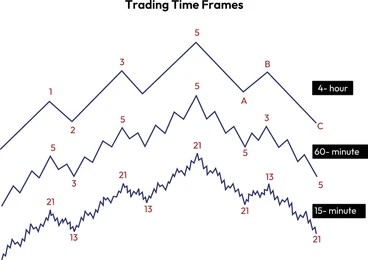
Some traders choose to trade multiple time frames backed by Charles Dow's theory of primary, secondary, and minor market moves, where markets move in long-term trends, medium-term swings, and short-term fluctuations. By viewing multiple timeframes, traders gain a clearer picture of trend direction, momentum, and potential turning points, leading to more informed and higher-probability trades.
The idea is simple: a trading signal becomes stronger when it aligns across different timeframes. A setup that appears on a lower timeframe is more reliable when the higher timeframe supports the same direction. For example, a short-term downtrend on a 5-minute chart might look like a selling opportunity, but when you check the 1-hour or 4-hour chart, you may realize it's only a temporary pullback within a larger uptrend. Entering short in that situation means trading against the dominant trend.
Likewise, a buy signal on a 5-minute chart carries more weight when the 1-hour chart is also trending upward and showing strong momentum. On the other hand, if the daily chart shows an uptrend but the weekly chart is beginning to form lower highs or bearish divergence, it warns that the larger trend may be weakening, helping you avoid entering late into a move that's close to reversing.
The key advantage of multi-timeframe analysis is alignment. When short-, medium-, and long-term charts point in the same direction, trades become clearer and more confident. Instead of chasing random signals, you wait for structure and confirmation, which reduces false entries and improves overall consistency.
This is why many traders combine timeframes, using longer timeframes to define trend direction, and shorter timeframes to fine-tune entries and exits. This helps with refining trading strategy and making profitable decisions.
Read More: Does the 10 AM Rule in Stock Trading Work?
What Timeframe Do Day Traders Use?
Day traders primarily operate on short-term charts because their goal is to capture daily price movements. The most commonly used timeframes for day trading are the 1-minute, 5-minute, 15-minute, and 1-hour charts. These timeframes allow day traders to spot quick trend shifts, breakout opportunities, and momentum bursts within a single trading session. Many day traders also keep an eye on the daily chart to understand the broader trend, key support and resistance levels, and overall market bias before executing lower-timeframe trades.
Scalpers operate on even faster timeframes. They often use tick charts, seconds charts, or the 1-minute chart to capture very small price movements repeatedly throughout the day. Because their trades last only seconds to minutes, scalpers rely heavily on speed, precision, and real-time order flow.
Swing traders focus on holding trades for several days to weeks, so they typically use the 4-hour and daily charts to identify sustained price moves. Position traders, who hold trades for weeks to months, rely mainly on weekly and monthly charts to track long-term trends and major market cycles.
No matter the trading style, multiple timeframe analysis plays an important role. For example, a day trader might use the daily chart to identify the overall trend, the 1-hour chart to locate key levels, and the 5-minute chart to time precise entries. Likewise, a scalper may confirm trend direction on the 1-hour chart before executing rapid entries on the 1-minute chart.
As you gain experience, you'll naturally experiment with different timeframes until you find the combination that best fits your trading style and personality.
Match Your Personality to a Timeframe
Here's a simple guideline to match your personality to a timeframe:
| Personality | Suggested Timeframe | Typical Trade Frequency | Notes |
|---|---|---|---|
| Quick-reacting, low patience | 1m–3m | 20–50 trades/day | Scalping style thrives on speed, but stressful and requires constant focus |
| Balanced, moderate risk tolerance | 5m–15m | 5–20 trades/day | Standard for day trading, a manageable pace, balances opportunities and risk |
| Patient, low-stress | 30m–1H | 2–10 trades/day | Swing-style trades, fewer signals but more reliable, less monitoring needed |
Final Thoughts
There's no single "perfect" timeframe for every trader. While shorter timeframes offer more opportunities, they demand speed, discipline, and emotional control. Longer timeframes provide clearer trends and calmer decision-making, but fewer trade setups.
It is important to know the time frame that suits your strategy, test different charts, track your performance, and refine before switching strategies. When your timeframe aligns with your trading style, your setups become clearer, your risk management improves, and your confidence grows naturally.
Related Read: Best Chart Patterns for Day Trading in 2026 (With Examples & Trading Tips)
Frequently Asked Questions
What is the best timeframe for day trading?
It depends on your trading style and risk tolerance. Scalpers use 1–3 minute charts, standard day traders 5–15 minutes, and patient traders 30-minute or 1-hour charts.
Can I trade multiple timeframes?
Yes. Many traders use higher timeframes for trend analysis and lower timeframes for entry and exit timing.
Do faster timeframes always mean more profit?
Not necessarily. Faster charts create more trades but also more noise, false signals, and stress. Profit depends on discipline, not speed.
How do I know if my timeframe suits me?
Track stress, overtrading tendencies, and consistency. If you panic or deviate from the rules, your timeframe may be too fast.
Can calculators help with choosing a timeframe?
Absolutely. Position sizing and risk calculators ensure you can handle the volatility and stops required for your selected timeframe.
What is the best time frame for day trading beginners?
Beginners should start with 15-minute charts, offering fewer but higher-quality signals and less stress than 5-minute scalping charts.
How do I choose a time frame for scalping?
Scalpers typically use 1–5 minute charts, focusing on fast, small moves. Ensure your platform supports low-latency execution.
Do time frames affect profit potential?
Yes. Shorter charts offer more trade opportunities but smaller average gains per trade, while longer charts provide fewer trades but larger moves.
How does risk management change by time frame?
Shorter time frames require tighter stop-losses and smaller position sizes. Longer time frames allow wider stops and larger positions proportionally.
Follow Us On Social Media