Double Top Chart Pattern: Meaning, Formation, and Trading Strategy
Double top chart pattern explained with real examples, trading strategies, risk management tips, and common mistakes traders should avoid.

At the other end of the double bottom chart pattern is the double top chart pattern, one of the most popular and reliable bearish reversal patterns in technical analysis, and is usually used to identify a potential reversal in an upward trend. Traders across stocks, forex, and cryptocurrency markets use it to identify potential trend reversals and high-probability selling opportunities.
In this guide, you'll learn what a double top chart pattern is, how it forms, how to trade it step by step, and common mistakes traders should avoid.
What Is a Double Top Chart Pattern?
The double top chart pattern is a bearish reversal pattern that appears after an uptrend. It signals that buying pressure is weakening and that sellers may soon take control of the market.
Visually, the pattern resembles the alphabet "M", formed by two peaks at roughly the same price level, separated by a temporary pullback.
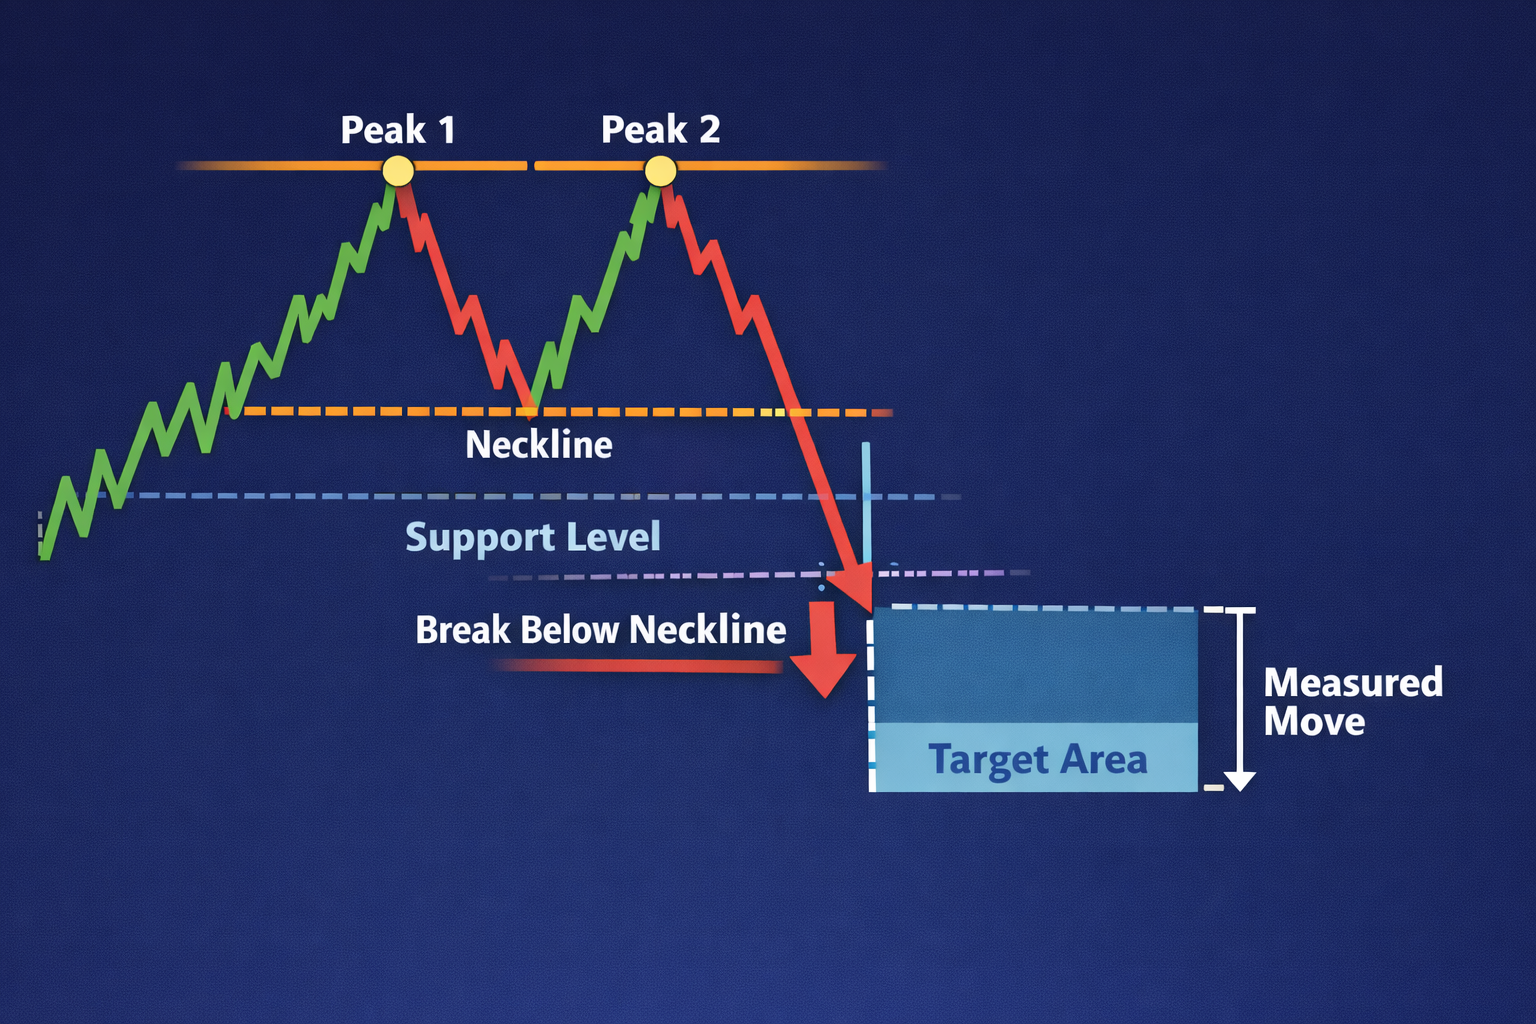
The first peak in the pattern indicates that prices are showing a strong buying momentum, followed by a pullback, indicating early profit-taking. The second top fails to break higher, showing buyer exhaustion; a break below the neckline confirms bearish control. Once confirmed, the double top often leads to a trend reversal or significant pullback.
Take, for example, a stock that rallies from $50 to $80: The price first hits $80 and pulls back to $72. Price rises again to $79–$80 but fails to break higher. Support at $72 acts as the neckline. When the price breaks below $72, the double top is confirmed. This breakdown often triggers aggressive selling from traders who were waiting for confirmation.
How the Double Top Chart Pattern Forms
A valid double top chart pattern develops in four key stages:
Strong Uptrend: The market must be in a clear uptrend before the pattern forms; in this case, the uptrend should have started several months before. Without a prior uptrend, the double top loses significance.
First Peak: A good trader will observe the first peak, which occurs when the price reaches a resistance level and pulls back as traders take profits. The first peak cannot be used to conclude that a trend reversal is taking place, at least not yet.
Neckline: Here is where a decline in price separates the two peaks. The pattern is confirmed only when the price breaks below the neckline, which is the support level between the two peaks.
Second Peak: From here, the price rises again but fails to break above the first peak, showing weakening bullish momentum. It is characterized by low volume and forms slightly below the first peak, indicating resistance and exhaustion. After the second peak forms, the subsequent decline should be accompanied by rising volume, signaling that sellers are gaining control and supply is beginning to outweigh demand.
A double top is not valid until the neckline is broken. The timing between the two peaks is also crucial. If they occur too close together, the formation is more likely to be simple price consolidation, with the market oscillating between support and resistance before continuing its prior trend, rather than a true reversal.
Volume analysis provides further confirmation: the first peak should form on higher volume, followed by a decline to the neckline on lighter volume. The rally to the second peak typically occurs on reduced volume as well, reflecting weakening buying pressure. Together, these signals help traders distinguish a genuine double top reversal from mere consolidation.
Key Characteristics of a Double Top Pattern
To identify a high-quality double top chart pattern, look for the following features:
- Two similar highs at a resistance level
- Clear neckline support between the peaks
- Declining volume on the second peak
- Bearish candle confirmation near the neckline
- Forms on higher timeframes (more reliable), but depending on the trading timeframe, the distance between the two peaks should not be too close.
Work with relevant technical indicators to easily identify the pattern. Moving averages (MA), Relative Strength Index, and oscillators are reliable indicators.
The more clearly defined these elements are, the stronger the pattern.
How to Trade the Double Top Chart Pattern
Here's a step-by-step trading strategy for the double top chart pattern:
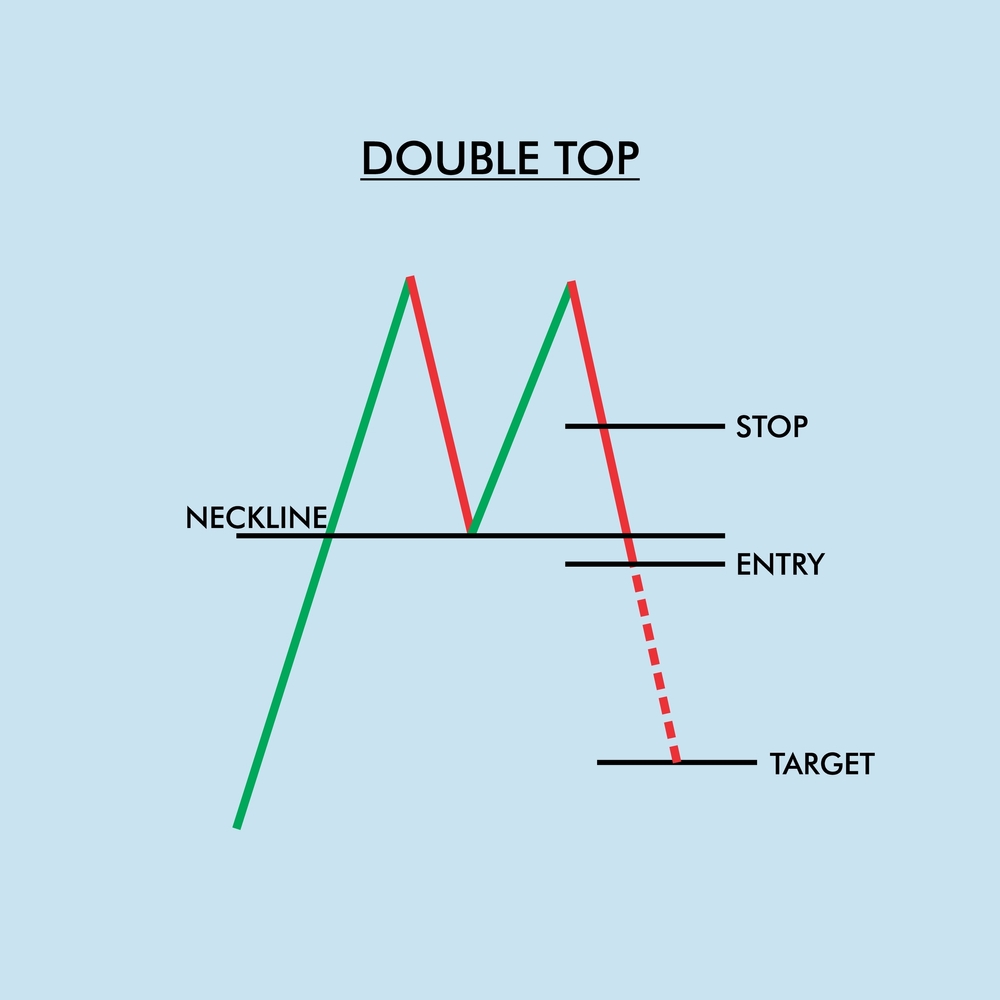
Entry Point: The safest way to trade a double top is to wait until the price closes below the neckline (the support level between the two peaks). This confirms that sellers have taken control, and the reversal is underway. Conservative traders often prefer to wait for a pullback retest of the neckline after the breakdown, entering short only if the price fails to reclaim support. This reduces the risk of false breakouts but requires patience and discipline. Aggressive traders may enter immediately after the breakdown, but this approach demands strict risk management.
Stop-Loss Placement: Risk control is critical. A common stop-loss placement is just above the second peak, since a break above that level invalidates the pattern. Alternatively, if entering after a retest, stops can be placed just above the neckline to protect against failed breakdowns. Stops should not be too tight, as minor whipsaws are common before the trend fully develops.
Profit Target: Traders often use the measured move technique to set profit targets. This involves measuring the vertical distance from the peaks down to the neckline, then projecting that same distance downward from the breakout point. This gives a logical target aligned with the pattern's structure. However, traders should also adjust targets based on nearby support zones and overall market conditions. Partial profit-taking along the way can help lock in gains while reducing exposure.
Risk–Reward Ratio: No setup is worth trading without a favorable risk–reward profile. For the double top, traders should aim for at least 1:2 or 1:3, meaning the potential reward is two to three times greater than the risk. Avoid trades where the target is too close to support or where stop-loss levels make the ratio unattractive. Maintaining discipline with risk–reward ensures that even if some trades fail, the winners outweigh the losers over time.
These strategies highlight the balance between confirmation, patience, and risk management. The double top is powerful, but only when traded with discipline; jumping in too early or ignoring volume and context often leads to traps.
Read More: How to Calculate Position Size & Manage Risk Like a Pro Trader
Double Top vs Double Bottom Chart Pattern
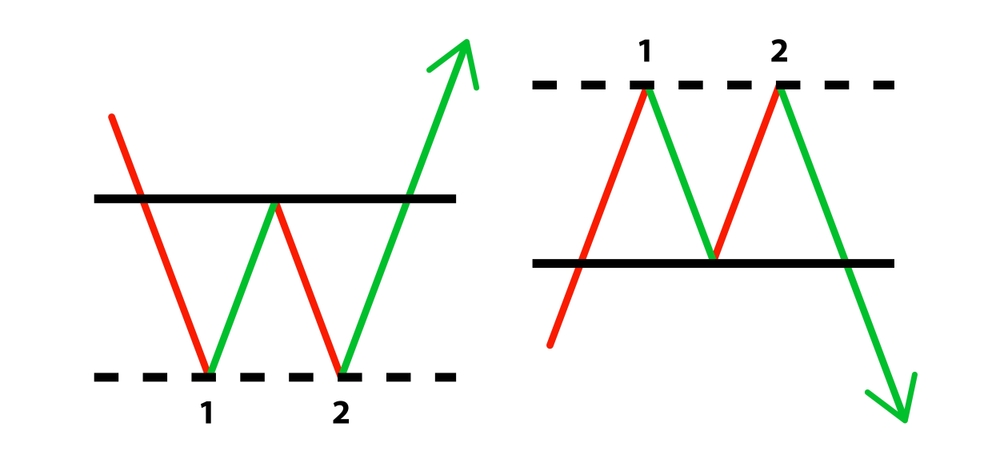
The double top and double bottom are classic reversal patterns that mirror each other in opposite market conditions. A double top forms after an uptrend and signals a shift to a downtrend, carrying a bearish bias and resembling the letter "M." It is confirmed when the price breaks below the neckline, the support level between the two peaks.
In contrast, a double bottom develops after a downtrend and indicates a move toward an uptrend, with a bullish bias and a shape that resembles the letter "W." This pattern is validated when the price breaks above the neckline, the resistance level between the two troughs. While both patterns serve as reversal signals, they operate in opposite directions, one warning of weakness and the other of strength.
To distinguish them both:
Feature
Double Top
Double Bottom
Trend
Bearish
Bullish
Characteristics
Uptrend → Downtrend
Downtrend → Uptrend
Shape
M
W
Confirmation
Break below the neckline
Break above the neckline
Pros and Cons of Trading The Double Top Chart Pattern
Understanding the advantages and limitations of the double top chart pattern helps traders apply it more effectively and avoid common pitfalls. While the pattern can provide high-quality bearish signals, it is not without weaknesses.
Pros:
- Signals a Potential Trend Reversal: One of the main benefits of the double top pattern is that it can indicate a possible shift from an uptrend to a downtrend. When price fails twice to break above the same resistance level, it suggests that buying pressure is weakening and sellers may begin to dominate. For day traders, this creates an opportunity to prepare for a trend change rather than reacting after it has already occurred.
- Supports Risk–Reward Planning: Because stop losses are usually placed just above the second peak and targets are based on pattern height, the double top often allows traders to aim for a reasonable risk–reward ratio. This structured setup is especially helpful for maintaining consistency over time.
- Provides a Clear Resistance Level: The two peaks in a double top form a well-defined resistance area. This level is useful for evaluating market strength, placing stop-loss orders, nd helps trader plan their trades with a clearer structure. Having visible resistance improves decision-making and helps manage risk more consistently.
- Offers Defined Entry and Exit Levels: The neckline acts as a key confirmation level. A break below it provides a clear signal to enter a short trade, while failure to break it invalidates the pattern. Traders can also estimate profit targets by measuring the distance from the peaks to the neckline and projecting it downward. This approach helps establish realistic exit points instead of relying on guesswork.
- Easy to recognize visually: Its M shape is easily recognizable across all markets.
Cons:
- False Signals Are Possible: The double top pattern does not always lead to a reversal. In some cases, price may form two peaks and then continue higher, resulting in a failed pattern. For this reason, traders should wait for confirmation, such as a clear neckline break and supporting indicators, before entering a trade.
- Involves subjective interpretation: There is no single "perfect" double top. Traders may interpret: the similarity of the peaks, the placement of the neckline, or the timing of the pattern differently. This subjectivity can lead to varied trade decisions, particularly among less experienced traders.
- Pattern Shape Can Vary: Double top patterns are not always symmetrical. Differences in spacing, peak height, or pullback depth can make it harder to determine exact entry and exit levels. This variability requires flexibility rather than strict rules.
- Profit Targets May Be Limited: Profit targets are usually based on the height of the pattern. In some market conditions, the price may not reach the projected target, or the potential reward may be relatively small compared to the stop loss. Traders should always evaluate whether the setup offers enough potential reward to justify the risk.
Conclusion
The double top chart pattern remains one of the most widely followed bearish reversal patterns in technical analysis, and for good reason. Its clear structure, defined resistance level, and measurable risk–reward framework make it valuable for traders across stocks, forex, and cryptocurrency markets.
However, the true effectiveness of the double top lies not in spotting the "M" shape alone, but in waiting for confirmation, understanding market context, and applying disciplined risk management. Volume behavior, the strength of the preceding uptrend, and work with other technical indicators to separate high-quality setups from false signals. When traded with patience and structure, the double top can help traders anticipate trend reversals rather than react to them.
Related Read: How to Identify and Trade the Double Bottom Pattern
Frequently Asked Questions
Is the double top chart pattern reliable?
▼
The double top pattern is considered moderately to highly reliable when confirmed by a neckline break, declining volume on the second peak, and supportive technical indicators. Reliability improves on higher timeframes and in markets showing clear prior uptrends.
Can a double top pattern fail?
▼
Yes. A double top can fail if the price breaks above the second peak or quickly reclaims the neckline after a breakdown. Failed patterns often occur when traders enter too early or ignore volume and broader market conditions.
Is a double top better for day trading or swing trading?
▼
The double top works for both, but it is generally more reliable for swing trading and position trading on higher timeframes. Day traders can still use it on lower timeframes, but should expect more false signals and tighter risk controls.
Can the two peaks be at different price levels?
▼
Yes. The peaks do not need to be exactly equal. Slight differences are normal. What matters more is that both peaks occur near the same resistance zone and that the second peak shows weaker momentum or volume.
Does a double top always lead to a downtrend?
▼
Not always. Sometimes it results in a temporary pullback rather than a full trend reversal. This is why traders should assess overall trend strength, nearby support levels, and market structure before setting expectations.
Which indicators work best with the double top pattern
▼
Commonly used indicators include: RSI (bearish divergence), Moving Averages (dynamic resistance), MACD (momentum weakening), and Volume indicators. Using indicators for confirmation helps improve your trade quality.
Is the double top pattern suitable for beginners?
▼
Yes, because it is visually clear and structurally simple. However, beginners should focus on confirmation, stop-loss discipline, and realistic targets, rather than trading every apparent formation.
Double Top Pattern Chart Patterns Bearish Reversal Technical Analysis Trading Strategy Price Action
Frequently Asked Questions
Is the double top chart pattern reliable?
The double top pattern is considered moderately to highly reliable when confirmed by a neckline break, declining volume on the second peak, and supportive technical indicators. Reliability improves on higher timeframes and in markets showing clear prior uptrends.
Can a double top pattern fail?
Yes. A double top can fail if the price breaks above the second peak or quickly reclaims the neckline after a breakdown. Failed patterns often occur when traders enter too early or ignore volume and broader market conditions.
Is a double top better for day trading or swing trading?
The double top works for both, but it is generally more reliable for swing trading and position trading on higher timeframes. Day traders can still use it on lower timeframes, but should expect more false signals and tighter risk controls.
Can the two peaks be at different price levels?
Yes. The peaks do not need to be exactly equal. Slight differences are normal. What matters more is that both peaks occur near the same resistance zone and that the second peak shows weaker momentum or volume.
Does a double top always lead to a downtrend?
Not always. Sometimes it results in a temporary pullback rather than a full trend reversal. This is why traders should assess overall trend strength, nearby support levels, and market structure before setting expectations.
Which indicators work best with the double top pattern
Commonly used indicators include: RSI (bearish divergence), Moving Averages (dynamic resistance), MACD (momentum weakening), and Volume indicators. Using indicators for confirmation helps improve your trade quality.
Is the double top pattern suitable for beginners?
Yes, because it is visually clear and structurally simple. However, beginners should focus on confirmation, stop-loss discipline, and realistic targets, rather than trading every apparent formation.