If you're trying to become a better trader, understanding chart patterns can be a total game-changer. One of the most powerful and reliable chart patterns used by day traders and swing traders alike is the flag pattern. Whether you're just getting started or you've been trading for a while, learning how to recognize flag patterns in stocks can help you find high-probability trades, time your entries and exits better, and ultimately increase your chances of success.
In this guide, we'll break down everything you need to know about flag patterns—from the basics of how they form, to how you can spot and trade them confidently. We'll also cover real examples, simple strategies, and tips that anyone can understand, even if you're still in high school.
Let's get into it.
What Are Flag Patterns in Stocks?
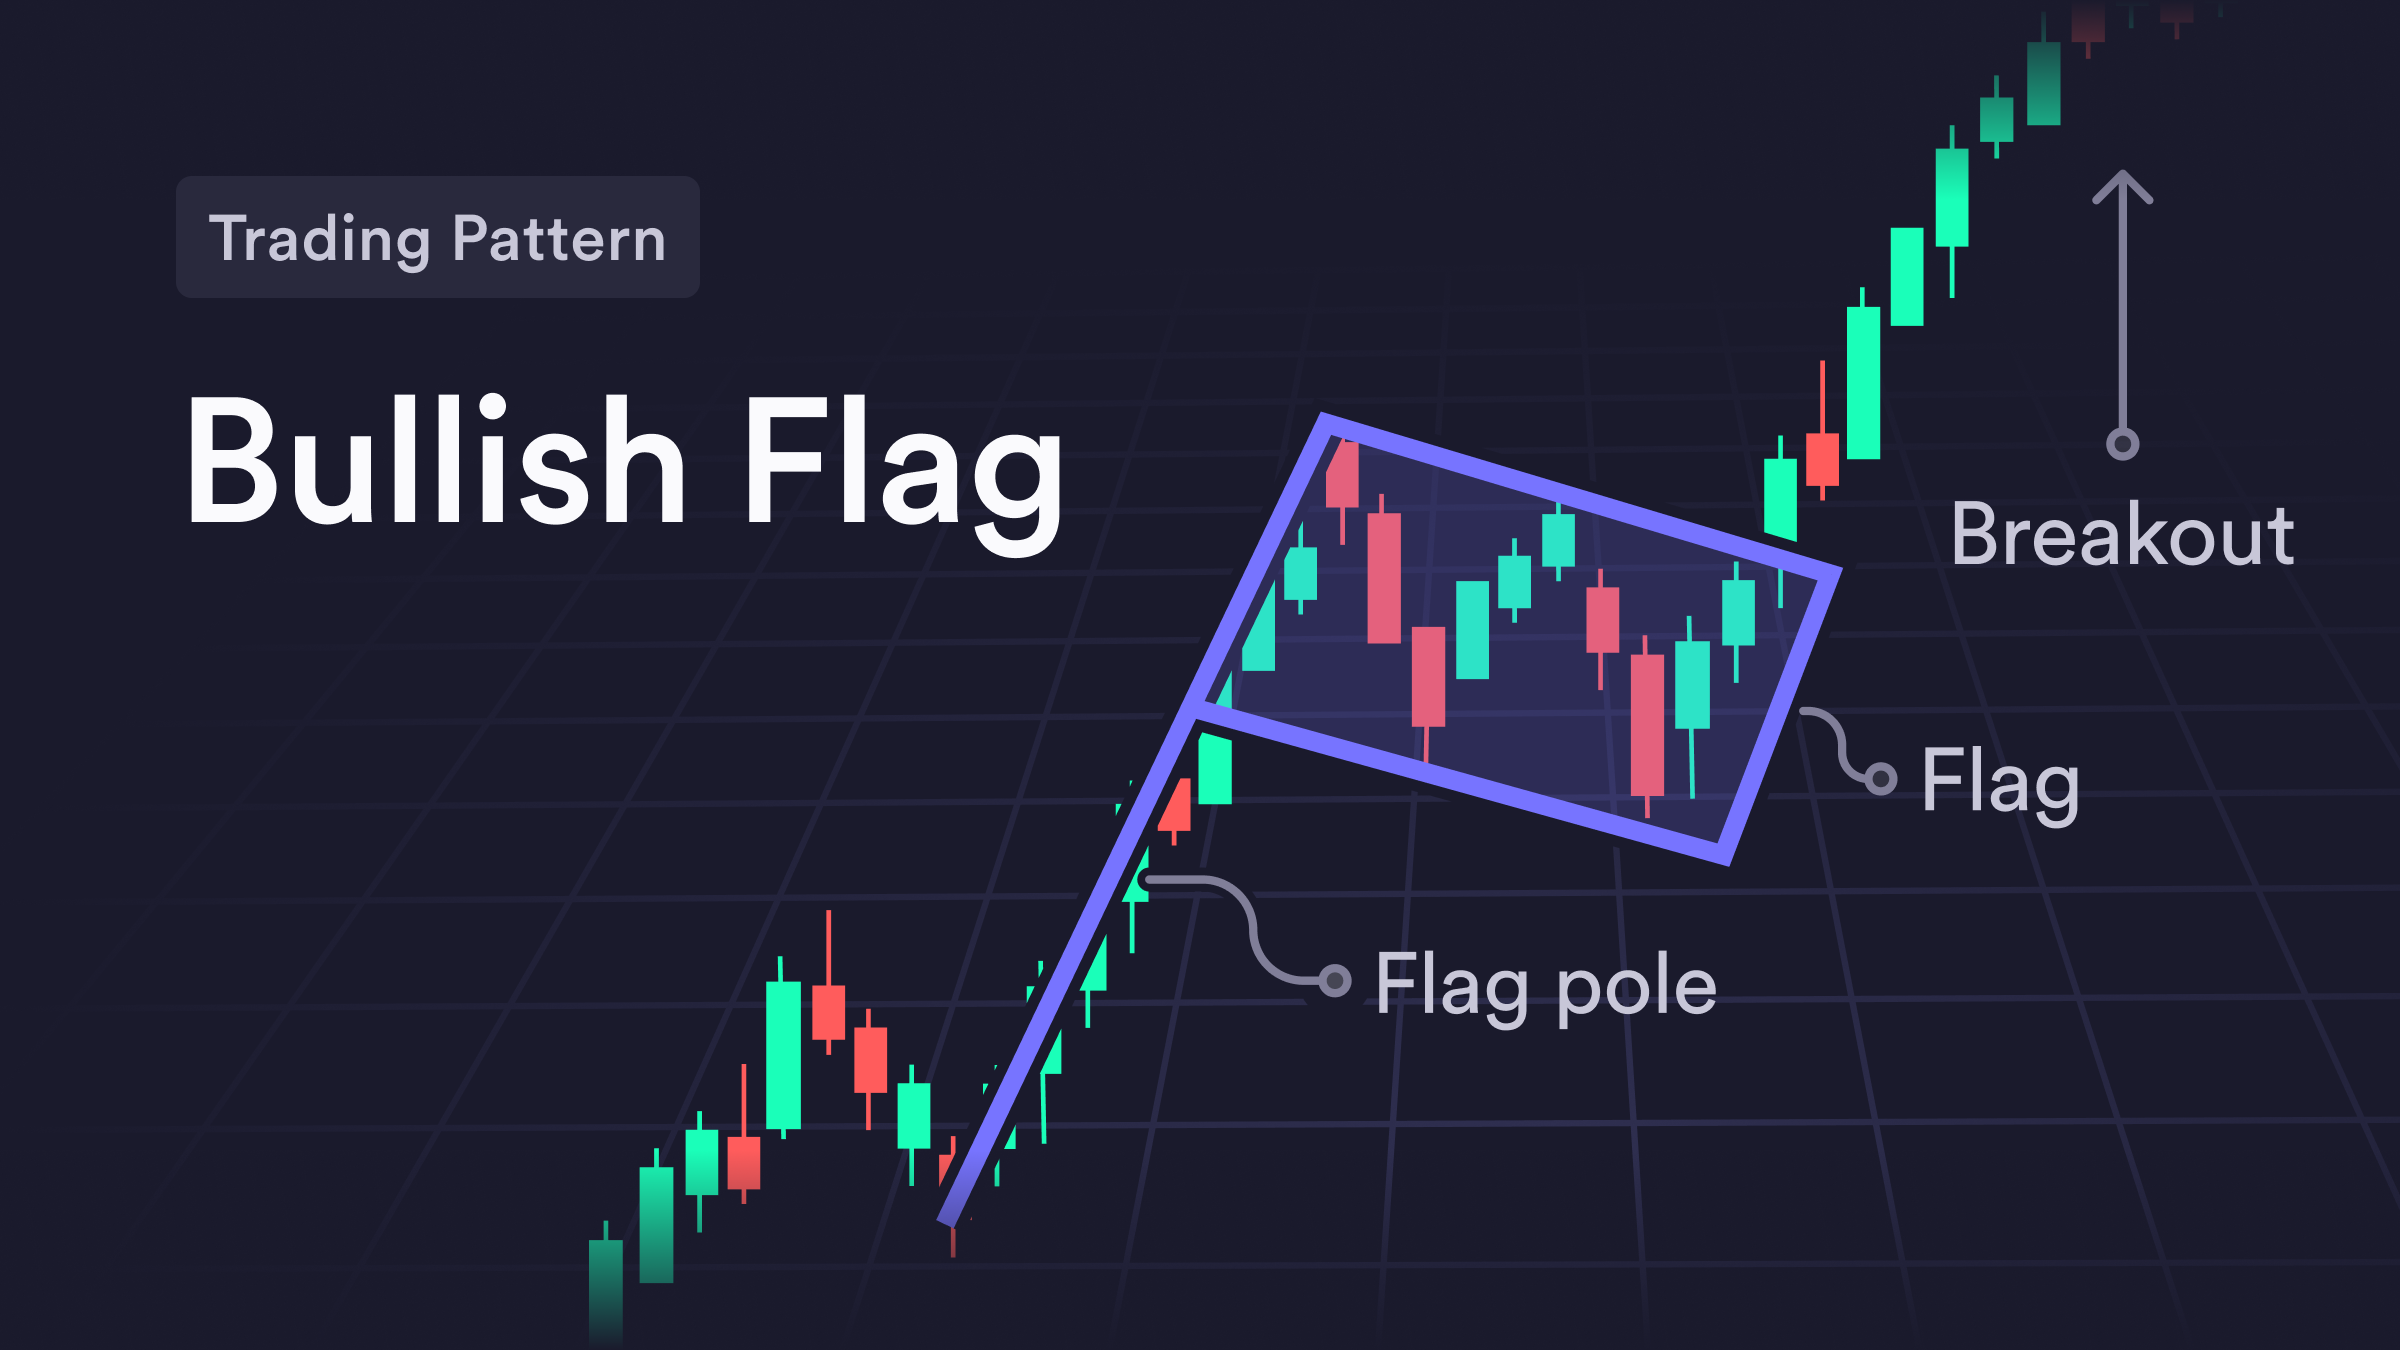
A flag pattern is a type of chart pattern that forms when a stock experiences a strong price move, followed by a brief period of sideways or slightly sloped price action, and then another strong move in the same direction. It basically looks like a little flag on a flagpole when you see it on a price chart.
Here's how it works:
- The flagpole is the sharp price movement (either up or down).
- The flag is the short period of consolidation that follows, where the stock "rests" before continuing in the same direction.
This pattern is considered a continuation pattern, which means that it usually signals that the price will keep moving in the same direction once the flag is complete. So, if a stock is going up, forms a bull flag, and breaks out, it's likely to keep going up. If it's going down and forms a bearish flag pattern, it's likely to continue dropping.
Flag patterns are popular because they happen fairly often and are easy to recognize once you know what to look for. They also work well with other tools like volume analysis and trendlines.
Bull Flag Pattern: The Bullish Flag Setup

Let's start with the bull flag pattern. This is one of the most well-known and reliable chart patterns used in flag pattern trading.
A bull flag forms when a stock makes a strong upward move (the flagpole), followed by a brief period of downward or sideways consolidation (the flag), and then breaks out to continue rising.
Think of it like this: the stock runs hard, takes a quick nap, then gets back to work. That short nap is the flag.
You'll usually see lower volume during the flag and a spike in volume when the breakout happens. That's your signal that the next leg up might be starting.
Let's say a stock jumps from $10 to $15 in one day. The next couple of days, it drifts lower to $14 and just chops around for a bit. Then, suddenly, it breaks out past $15 with higher volume. That's a classic bull flag.
The key thing to remember is that bull flags suggest continuation. Traders often enter when the price breaks above the top of the flag with strong volume, aiming to catch the next move up.
Bearish Flag Patterns: The Bear Flag Setup
Now let's flip the script.
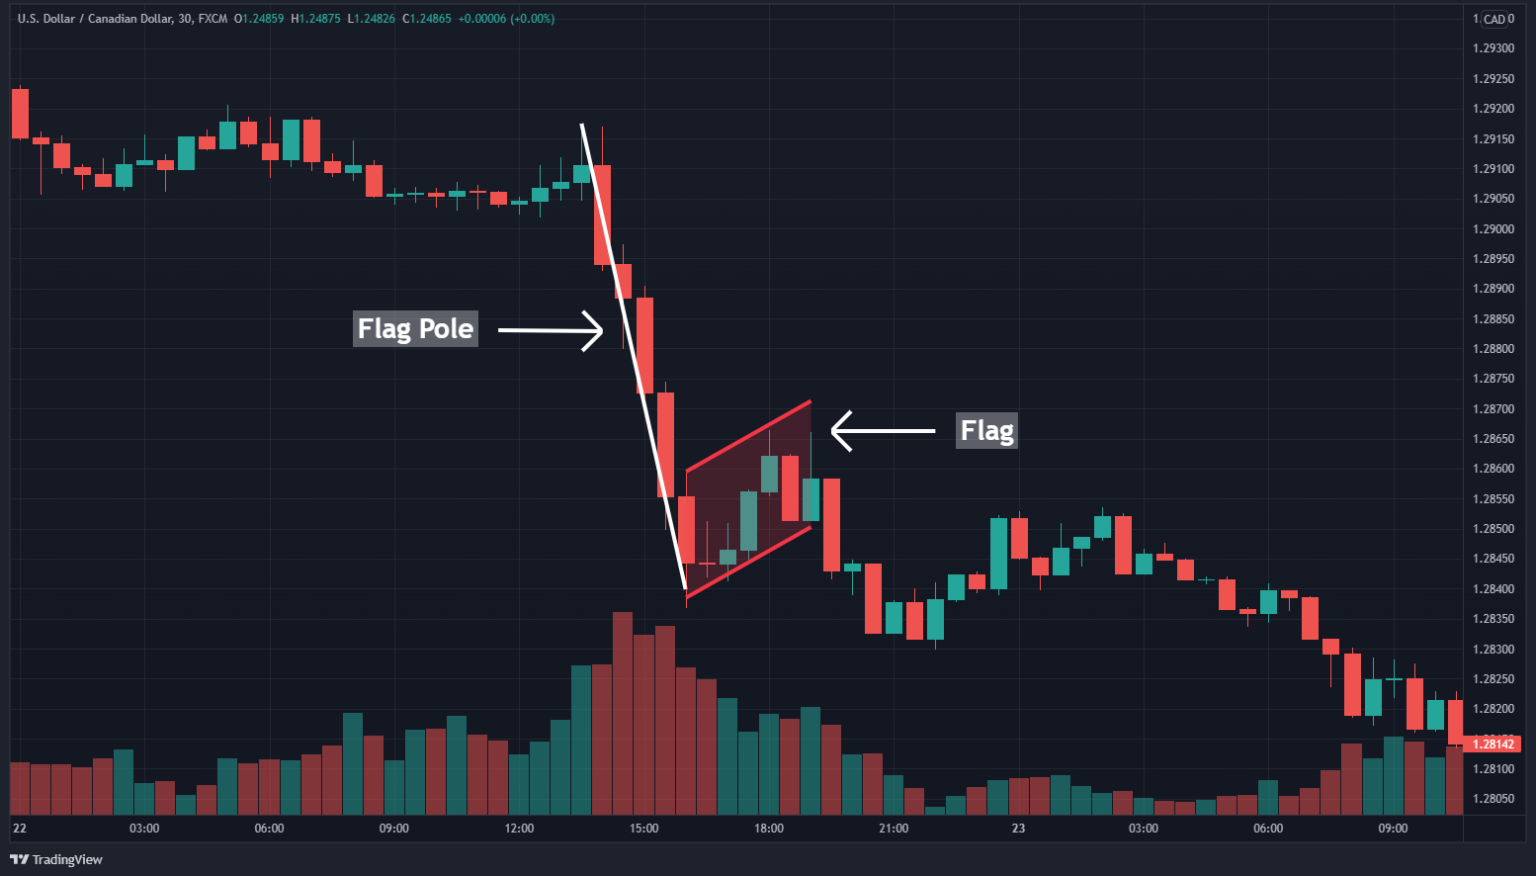
A bearish flag pattern is the opposite of a bull flag. It forms when a stock has a steep drop (the flagpole), followed by a short period of upward or sideways consolidation (the flag), and then breaks down to continue moving lower.
It's like the stock takes a nosedive, catches its breath for a moment, and then continues falling.
This type of chart flag pattern is used to spot opportunities to short a stock or avoid buying into a falling knife.
For example, a stock might drop from $30 to $20 in a day, then inch back up to $22 over the next two days. If it breaks below $20 again with rising volume, that could be the start of another leg lower. That's your bear flag in action.
Just like bull flags, bearish flag patterns are great for traders who want to time their trades with the trend.

How to Identify Flag Patterns Like a Pro
You don't need to be a market wizard to identify flag patterns. Once you understand what they look like and how they behave, you'll start seeing them pop up all over your charts.
Here's what to look for:
- First, find the flagpole: a sharp, clean move either up (bull flag) or down (bear flag).
- Next, look for the flag: this is the consolidation zone. It usually looks like a small downward (bull flag) or upward (bear flag) sloping channel.
- Make sure the volume drops during the flag and then spikes on the breakout or breakdown.
- The breakout point should be at the top of the flag (for a bull flag) or the bottom (for a bear flag).
You can also use trendlines to mark the top and bottom of the flag. Once price breaks out of this range with higher volume, you may have a trade setup.
It's important to practice identifying flag patterns in different timeframes—like the 5-minute, 1-hour, or daily chart—depending on your trading style.
Flag Pattern Trading Strategies
Trading a flag pattern doesn't need to be complicated. In fact, keeping it simple is usually best.
Here's a common strategy:
- Wait for the flag to fully form.
- Place an entry order just above the top of the flag (for bull flags) or just below the bottom (for bear flags).
- Use the bottom of the flag (bull flag) or top of the flag (bear flag) as your stop-loss.
- Set a target based on the height of the flagpole. That's how much you expect the stock to move once the pattern breaks out.
Let's say the flagpole on a bull flag is $5 high. Once the flag breaks out, you could aim for a $5 move from the breakout point.
One great tip? Use a day trading profit calculator to test your flag pattern trades before risking real money. That way, you can see how your strategy would have performed historically.
Also, make sure you're trading flag patterns with the overall market trend. Don't try to go long a bull flag in a bearish market—you're swimming upstream.
Real-World Examples of Flag Pattern Stocks
Let's look at some real-life examples of flag pattern stocks. These are simplified, but they'll help you see how the pattern plays out.
Example 1: Bull Flag on a Tech Stock
A tech stock shoots up from $50 to $70 over two days. Then it pulls back slowly to around $66 and trades sideways for a bit. Volume dries up. Then—boom!—a breakout past $70 with volume. That's your bull flag.
Example 2: Bear Flag on a Penny Stock
A small-cap stock crashes from $8 to $4. Then it bounces to $4.50 and trades in a tight range. A few days later, it breaks below $4 again. That's your bearish flag.
These patterns happen all the time in different sectors, especially when news or earnings cause big price moves. Keeping an eye out for flag pattern stocks can give you a big edge.
Common Mistakes When Trading Flag Patterns
Even though flag patterns are simple, traders often make mistakes. Here are a few to avoid:
- Jumping in too early before the breakout is confirmed.
- Ignoring volume. A breakout without strong volume is often a fakeout.
- Forcing a pattern where there isn't one. Not every pullback is a flag.
- Not using a stop-loss. Every trade needs a risk plan.
Remember, trading is about managing risk, not chasing perfection. Let the pattern come to you.
Conclusion
Flag patterns are one of the most reliable and easy-to-understand chart patterns for traders of all levels. Whether you're looking at a bull flag, a bearish flag pattern, or just trying to learn how to spot a candlestick flag pattern, the core idea is the same: strong move, short rest, continuation.
By learning to identify and trade flag patterns in stocks, you can improve your entries, manage your risk better, and increase your chances of finding winning trades.
Use what you've learned here to go back over old charts and practice spotting flag patterns. Then, when you're ready, try paper trading them with tools like a day trading profit calculator to see how your trades perform.
It's not magic—just pattern, patience, and practice. Happy trading!
FAQs
What is a flag pattern in stocks?
A flag pattern is a chart formation that happens after a big price move, followed by a short pause, and usually leads to a continuation of the trend.
How do you trade a bull flag pattern?
Wait for the flag to form after a sharp upward move, then buy when the stock breaks above the top of the flag with volume. Use the bottom of the flag as your stop-loss.
Are flag patterns reliable?
They're among the most reliable continuation patterns, especially when volume supports the breakout.
What's the difference between a bull flag and a bear flag?
A bull flag forms after a big upward move and suggests more upside. A bear flag forms after a big downward move and suggests more downside.
Need help calculating your risk and reward? Try out our free Day Trading Profit Calculator and start making smarter trades today.

Follow Us On Social Media