Ascending Triangle Chart Pattern: How Day Traders Spot Breakouts in 2026
Learn how to identify and trade the ascending triangle chart pattern. Understand breakout confirmation, market psychology, risk management, and tools for trading ascending triangles in 2026.

Chart patterns remain relevant because markets still move on human behavior. Among continuation patterns, the ascending triangle stands out for its clarity and structure. It offers traders a logical way to participate in trending markets without guessing tops or bottoms.
The ascending triangle is a staple pattern for traders because it clearly illustrates a shift in market psychology where buying pressure systematically overcomes selling pressure. This guide provides a comprehensive breakdown of the pattern, covering how to identify it, the market forces behind its formation, and effective trading strategies to turn chart theory into actionable opportunities.
Understanding the Ascending Triangle Chart Pattern
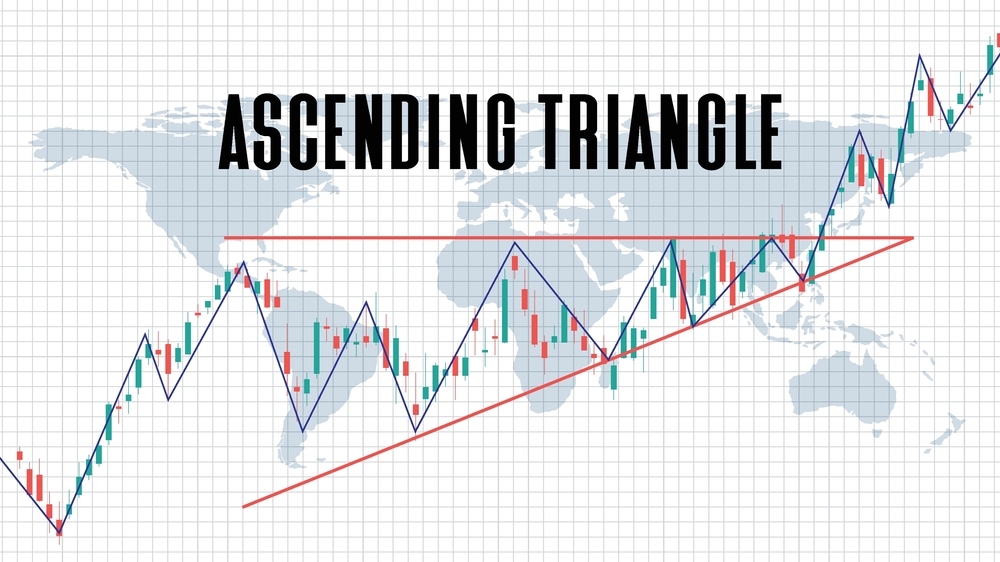
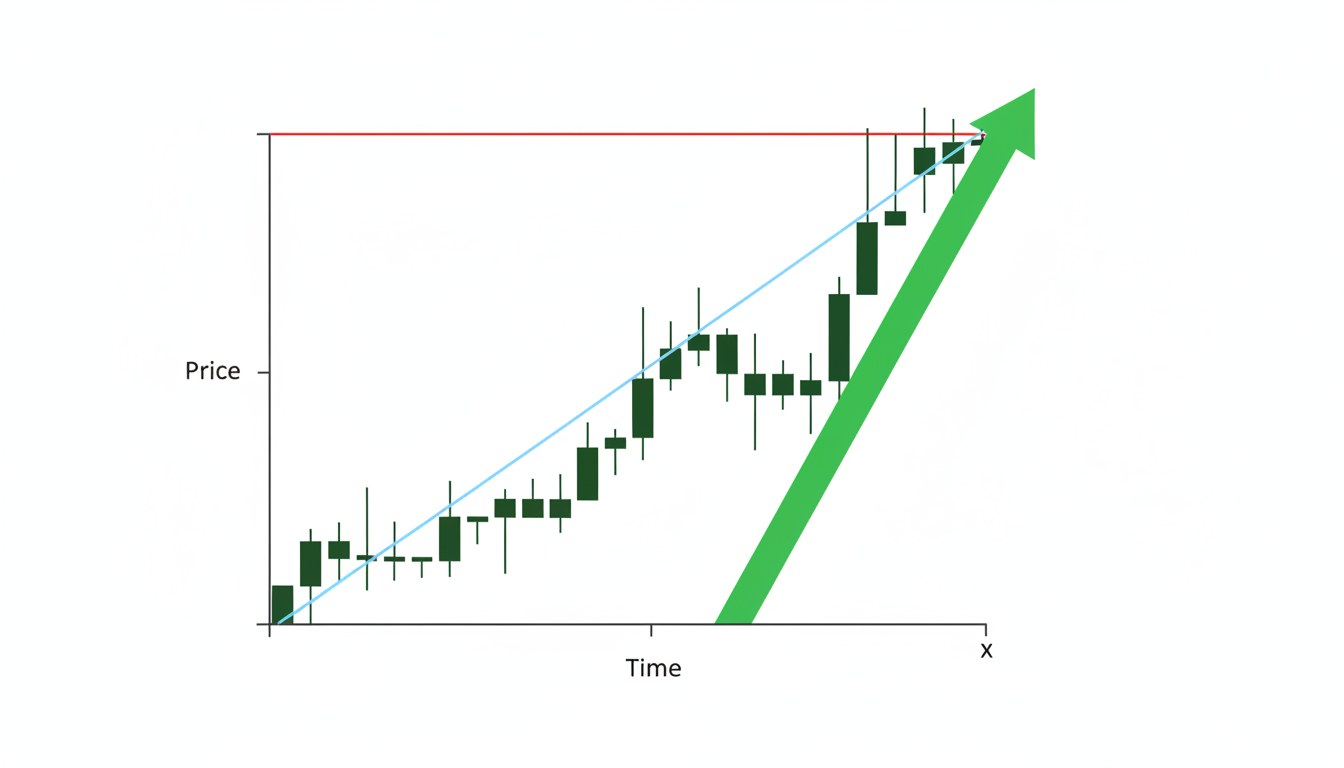
An ascending triangle pattern is defined by a horizontal resistance line at the top and an upward-sloping support line at the bottom. This structure creates a visual representation of price action being compressed between a flat price ceiling and a series of higher lows. As the price bounces between these two lines, it gets squeezed into a progressively tighter range as it approaches the triangle's apex. This consolidation, which often forms over several weeks or months on a daily or weekly stock chart ascending triangle, typically represents a period of accumulation before a potential price surge.
The two trendlines are the pattern's defining features:
- The Horizontal Resistance Line: This flat top is drawn by connecting at least two (preferably more) swing highs that occur at roughly the same price level. This line represents a supply zone where sellers have consistently stepped in to prevent the price from moving higher.
- The Ascending Support Line: This upward-sloping bottom is drawn by connecting at least two (and again, preferably more) swing lows. Crucially, each low is higher than the previous one, creating a series of "higher lows." This line shows that buyers are growing more aggressive, willing to pay progressively higher prices to acquire the stock.
Many times, traders ask; is an ascending triangle bullish or bearish? This chart pattern is bullish. The flat resistance line shows that sellers are defending a specific price point. However, the rising support line indicates that buyers are not deterred. Each time the price dips, they enter the market sooner and with more conviction, preventing the stock from returning to its previous lows. This relentless buying pressure gradually absorbs the supply at the resistance level until sellers are depleted. At that point, the price breaks through the ceiling, often with significant force. Therefore, the ascending triangle pattern is a clear signal of bullish accumulation.
While most often seen as a continuation pattern that forms during an established uptrend, the ascending triangle can also appear at the end of a downtrend, where it may signal a bullish reversal. The context of the preceding trend is vital for proper interpretation, but the underlying psychology of building buying pressure remains the same.
Identifying Key Components of an Ascending Triangle
Effective ascending triangle technical analysis depends on the accurate identification of its components. A poorly defined pattern can lead to flawed trading decisions; traders must validate each part of the structure before committing their capital.
- Trendline: First, focus on drawing the trendlines correctly. To establish the horizontal resistance, identify at least two distinct highs that peak at a very similar price level. Three or more touches make the resistance level even more significant and reliable. Minor price wicks above the line can be ignored; focus on the level where the price has repeatedly failed to close. This barrier, once broken, can trigger a rush of new buy orders. Next, to draw the ascending support line, connect a series of higher lows. Find at least two, but ideally three, swing lows where each subsequent low is clearly higher than the one before it. This upward slope is the non-negotiable visual proof of increasing buying pressure and is what distinguishes the ascending chart pattern from other triangle variations.
- Volume: Volume is the second critical component for confirmation. A classic ascending triangle stock pattern will exhibit a specific volume signature. As the price consolidates between the two trendlines, trading volume tends to decrease. This tapering volume reflects a period of equilibrium between buyers and sellers as they prepare for the next major move. The definitive signal, however, appears at the breakout. A legitimate breakout above the horizontal resistance should be accompanied by a significant spike in volume. This surge indicates strong conviction from buyers and confirms that the move has genuine momentum. A breakout on low volume is a major red flag, indicating a significantly higher probability of being a "false breakout" or a head fake.
- Timeframe: Finally, consider the timeframe. The ascending triangle trading pattern can appear on any chart, from a 5-minute intraday chart to a weekly one. However, the reliability and significance of the pattern generally increase with the timeframe. An ascending triangle that forms over six months on a weekly chart implies a much larger and more powerful potential move than one that forms over 60 minutes on an intraday chart. Longer-term patterns involve more capital and a more profound shift in sentiment, making their breakouts more robust and their price targets more meaningful for position traders and long-term investors.
Trading Strategies for Ascending Triangle Breakouts
While identifying an ascending triangle pattern breakout is the first step, trading it profitably requires a well-defined plan. A successful ascending triangle trade outlines your entry, exit, and risk management strategy from the start.
Wait for Confirmation
Confirmation can come in several forms. The most reliable signal is a candle closing convincingly above the resistance level on your chosen timeframe. For example, on a daily chart, you would wait for the daily candle to close above the line, which helps filter out intraday noise and false moves. As noted, this breakout should be validated by a substantial increase in trading volume. Some traders prefer an even more conservative approach by waiting for a "retest." This occurs when the price breaks out, then pulls back to test the old resistance line, which should now act as new support. A bounce off this level provides a secondary, often lower-risk, entry point and confirms the change in market structure.
Exit Strategy
Defining your exit strategy is equally important, beginning with a stop-loss. A stop-loss order is your safety net, protecting your capital if the trade moves against you. A common placement for a stop-loss is just below the breakout level, which limits the loss if the breakout fails and the price falls back into the triangle. A more conservative placement is below the most recent higher low within the pattern. This gives the trade more room to breathe, but also increases the potential loss size, so the choice depends on your personal risk tolerance.
Profit Targets
To determine your profit goal, you can calculate the target of the ascending triangle pattern. The standard method is straightforward: Measure the vertical distance between the horizontal resistance and the lowest point of the ascending support line. This is the "height" of the triangle at its widest point. Add this height to the breakout price. The result is your minimum price target.
For example, if a stock forms an ascending triangle with resistance at $100 and its lowest point at $90, the height is $10. If the stock breaks out at $100, the calculated ascending triangle target would be $110 ($100 + $10). This provides a logical objective for taking profits, though it is always wise to manage the trade as it develops, perhaps by using a trailing stop to lock in gains if the price runs well beyond the initial target.
Usually, the most common entry is a decisive move above the horizontal resistance line, but buying the instant the price crosses that threshold can be risky. Instead, prudent traders wait for confirmation before entry.
Read More: How to Calculate Profit Trading: Simple Formulas and Examples (2026)
Ascending Triangle Setups with Technical Indicator
While the ascending triangle is powerful on its own, combining it with a few technical indicators improves breakout accuracy.
- RSI: Relative Strength Index helps confirm momentum strength. During triangle formation, RSI often stabilizes as price compresses. A breakout accompanied by RSI pushing above 60–70 signals strong bullish momentum. Conversely, a breakout with RSI already deeply overbought warns of possible exhaustion.
- MA: Moving Averages help confirm trend alignment. Ascending triangles perform best when the price is above key averages such as the 20-day, 50-day, or 200-day MA. A breakout that also clears a major moving average adds weight to the bullish case and filters lower-quality setups.
Used together, RSI confirms momentum, while moving averages confirm trend direction, creating a simple, effective confirmation layer without cluttering your chart.
Common Mistakes To Avoid with Ascending Triangle Pattern
While the ascending triangle is a powerful tool, it is important to avoid some common mistakes while trading with it. You have to understand the nuances in different market contexts, which is crucial for avoiding common pitfalls.
- Mistaking Ascending Triangles in Downtrends for Guaranteed Reversals: A common scenario is the appearance of an ascending triangle in a downtrend. Although it is typically a continuation pattern, its formation after a prolonged price decline can signal a bullish reversal. The underlying logic is consistent: sellers are defending a price level while buyers are becoming more aggressive, suggesting a shift from distribution to accumulation. However, an ascending triangle pattern in downtrend scenarios requires extra caution. The prevailing bearish momentum can easily overpower the emerging buying pressure and cause the pattern to fail. For these reversal setups, it is highly recommended to wait for exceptionally strong volume on the breakout, and even a successful retest of the broken resistance, before entering a trade.
- Getting Trapped by False Breakouts: The most frustrating experience for a trader is the false breakout. This "head fake" occurs when the price moves above resistance, luring in buyers, only to quickly reverse and fall back into the pattern, trapping them in losing positions. To mitigate this risk, patience is your best ally. Avoid entering the moment the price pierces resistance. Instead, wait for a confirmed candle close above the level.
- Ignoring volume: Use volume as your filter; a true breakout is almost always driven by high volume, whereas a false one often occurs on weak volume. Considering the broader market context is also vital. Trading a bullish breakout pattern on a single stock when the entire market is in a steep decline is fighting an uphill battle. A bearish market can sink even the most perfect-looking bullish setups.
The ascending triangle is best used as a confirmation-based continuation setup, not a standalone signal. When combined with trend alignment, volume analysis, and disciplined risk management, it becomes a practical tool. Used in isolation, it becomes another source of false confidence.
Conclusion
The ascending triangle remains one of the cleanest and most logical continuation patterns in technical analysis. It visually captures the gradual shift in control from sellers to buyers, offering traders a structured way to participate in trend continuation without guessing market tops or bottoms.
When traded correctly, with confirmed breakouts, volume validation, and disciplined risk management, ascending triangles provide high-quality trading opportunities across stocks, forex, and crypto markets. Add simple confirmation tools like RSI, moving averages, and risk calculators, and the pattern becomes not just theoretical chart knowledge, but a practical trading strategy.
Related Read: Best Chart Patterns for Day Trading in 2026 (With Examples & Trading Tips)
Frequently Asked Questions
What is the difference between an ascending and a symmetrical triangle?
▼
An ascending triangle has a flat horizontal resistance line and a rising support line, making it a distinctly bullish pattern. A symmetrical triangle has both a descending resistance line and an ascending support line that converge toward an apex. A symmetrical triangle is considered a neutral pattern indicating consolidation, and the breakout can occur in either direction, typically continuing the preceding trend. The key difference lies in their trendlines and implications.
How reliable is the ascending triangle pattern?
▼
The ascending triangle is considered one of the more reliable bullish patterns in technical analysis, but no pattern is 100% certain. Its reliability increases significantly when confirmed by other factors, such as a strong volume surge on the breakout, a preceding uptrend, and positive overall market sentiment. Risk management, including the use of a stop-loss, is essential for every trade, regardless of a pattern's perceived reliability.
Can an ascending triangle fail?
▼
Yes, all chart patterns can fail. An ascending triangle may fail if the breakout lacks volume and conviction, leading to a "false breakout." The pattern can also break down below the ascending support line, which is a bearish signal that invalidates the pattern and often precedes a sharp price drop. This can happen due to unexpected negative news, a sudden shift in market sentiment, or the simple failure of buyers to overcome sellers at the resistance level.
What timeframe is best for trading ascending triangles?
▼
Ascending triangles appear on all timeframes, from 1-minute to monthly charts. While profitable trades can be made on any timeframe, patterns that form over longer periods (daily, weekly) are generally considered more significant. A breakout from a multi-month ascending triangle on a weekly chart suggests a major shift in the stock's supply and demand, often leading to a more substantial and sustained price move than a pattern that forms over a few hours on an intraday chart.
What happens if an ascending triangle breaks down instead of up?
▼
A breakdown is a significant event that completely invalidates the bullish thesis. If the price breaks below the upward-sloping support line, it signals that buyers have lost control and sellers have taken over. This bearish development often acts as a trigger for a sharp move lower. Traders who were anticipating a bullish breakout should exit their positions immediately. Aggressive traders may even view this breakdown as an opportunity to initiate a short position, targeting a downward move equivalent to the height of the triangle.
Ascending Triangle Chart Patterns Technical Analysis Breakout Trading Bullish Patterns Day Trading
Frequently Asked Questions
What is the difference between an ascending and a symmetrical triangle?
An ascending triangle has a flat horizontal resistance line and a rising support line, making it a distinctly bullish pattern. A symmetrical triangle has both a descending resistance line and an ascending support line that converge toward an apex. A symmetrical triangle is considered a neutral pattern indicating consolidation, and the breakout can occur in either direction, typically continuing the preceding trend. The key difference lies in their trendlines and implications.
How reliable is the ascending triangle pattern?
The ascending triangle is considered one of the more reliable bullish patterns in technical analysis, but no pattern is 100% certain. Its reliability increases significantly when confirmed by other factors, such as a strong volume surge on the breakout, a preceding uptrend, and positive overall market sentiment. Risk management, including the use of a stop-loss, is essential for every trade, regardless of a pattern's perceived reliability.
Can an ascending triangle fail?
Yes, all chart patterns can fail. An ascending triangle may fail if the breakout lacks volume and conviction, leading to a false breakout. The pattern can also break down below the ascending support line, which is a bearish signal that invalidates the pattern and often precedes a sharp price drop. This can happen due to unexpected negative news, a sudden shift in market sentiment, or the simple failure of buyers to overcome sellers at the resistance level.
What timeframe is best for trading ascending triangles?
Ascending triangles appear on all timeframes, from 1-minute to monthly charts. While profitable trades can be made on any timeframe, patterns that form over longer periods (daily, weekly) are generally considered more significant. A breakout from a multi-month ascending triangle on a weekly chart suggests a major shift in the stock's supply and demand, often leading to a more substantial and sustained price move than a pattern that forms over a few hours on an intraday chart.
What happens if an ascending triangle breaks down instead of up?
A breakdown is a significant event that completely invalidates the bullish thesis. If the price breaks below the upward-sloping support line, it signals that buyers have lost control and sellers have taken over. This bearish development often acts as a trigger for a sharp move lower. Traders who were anticipating a bullish breakout should exit their positions immediately. Aggressive traders may even view this breakdown as an opportunity to initiate a short position, targeting a downward move equivalent to the height of the triangle.