


In day trading, price moves fast, sometimes too fast for the average trader to interpret confidently. That's where oscillators come in. Oscillators are some of the most important tools in technical analysis because they help traders understand momentum, reversal points, trend exhaustion, and overbought/oversold conditions.
Whether you're trading stocks, forex, crypto, or futures, oscillators give a clearer picture of when a trend is weakening and when a potential reversal may be forming. Instead of relying only on raw price movements, which can be volatile and misleading, oscillators simplify market behavior into easy-to-read signals.
This guide breaks down exactly what oscillators are, how they work, the best types, and how to apply them to real-day trading strategies with confidence.
What Is an Oscillator in Day Trading?
An oscillator is a technical indicator that moves within a fixed range, typically 0 to 100 or -100 to +100, to help traders identify market momentum and potential turning points. As price fluctuates, the oscillator "swings" between high and low values, showing when a market is: overbought, oversold, losing momentum, or simply gaining momentum.
Investopedia simply puts an oscillator as a "pivotal tool in technical analysis, used to build a trend indicator that fluctuates between high and low extremes". Traders leverage oscillators to detect short-term overbought or oversold asset conditions, aiding in their search for market entry and exit points.
Day traders use oscillators because they provide early clues about market conditions before the price fully reacts. They are especially useful in sideways markets, where trend indicators like moving averages lag.
Common day trading oscillators include RSI, MACD, Stochastic Oscillator, Commodity Channel Index (CCI), and Money Flow (MFI).
How Oscillators Work
Oscillators work by measuring the speed and strength of price movements (momentum). Momentum is crucial in day trading because it helps determine whether a price trend is likely to continue or reverse.
Oscillators help traders check for momentum by comparing the current price with the past price. If today's move is stronger than the previous few periods, momentum increases. The momentum value is converted into a percentage scale. Common ranges include:
- RSI: 0–100
- Stochastic: 0–100
- MACD: fluctuates above/below 0
- CCI: typically -200 to +200
- MFI: 20 to 80
High oscillator readings indicate that the price may be overbought, while low readings indicate the price may be oversold.
Many oscillators also have a centerline (0 or 50). Above the centerline indicates a bullish momentum, while below the centerline indicates a bearish momentum. This helps day traders avoid placing trades against the trend.
Oscillators also help to reveal divergence. This occurs when price moves in one direction while the oscillator moves in another, a strong early signal that a reversal is forming.
Related Read: How to Trade Momentum Stocks: Strategies, Indicators & Risk Management
Why Oscillators Matter in Day Trading
Day trading requires fast, precise decisions. Oscillators help traders:
- Manage Volatility: Fast price swings can confuse beginners; oscillators simplify the chaos and show whether momentum is building or fading.
- Time Entries and Exits: Oscillators help spot the ideal buy points in oversold zones as well as the ideal sell points in overbought zones. Momentum shifts that hint at trend continuation.
- Avoid Bad Trades: Traders often lose money by chasing breakouts or buying at tops. Oscillators reduce emotional trading by providing objective signals.
- Confirm Breakouts or Breakdowns: Oscillators help traders confirm price breakouts. If the price breaks a level and the oscillator agrees, the breakout is more reliable.
- Identify Trend Weakness Early: A trend may look strong on the chart, but if the oscillator is slowing down, a reversal might be near. This helps traders avoid being trapped. Oscillators give day traders an edge by turning noisy price data into clear, measurable insights.
Types of Oscillators in Day Trading

Relative Strength Index
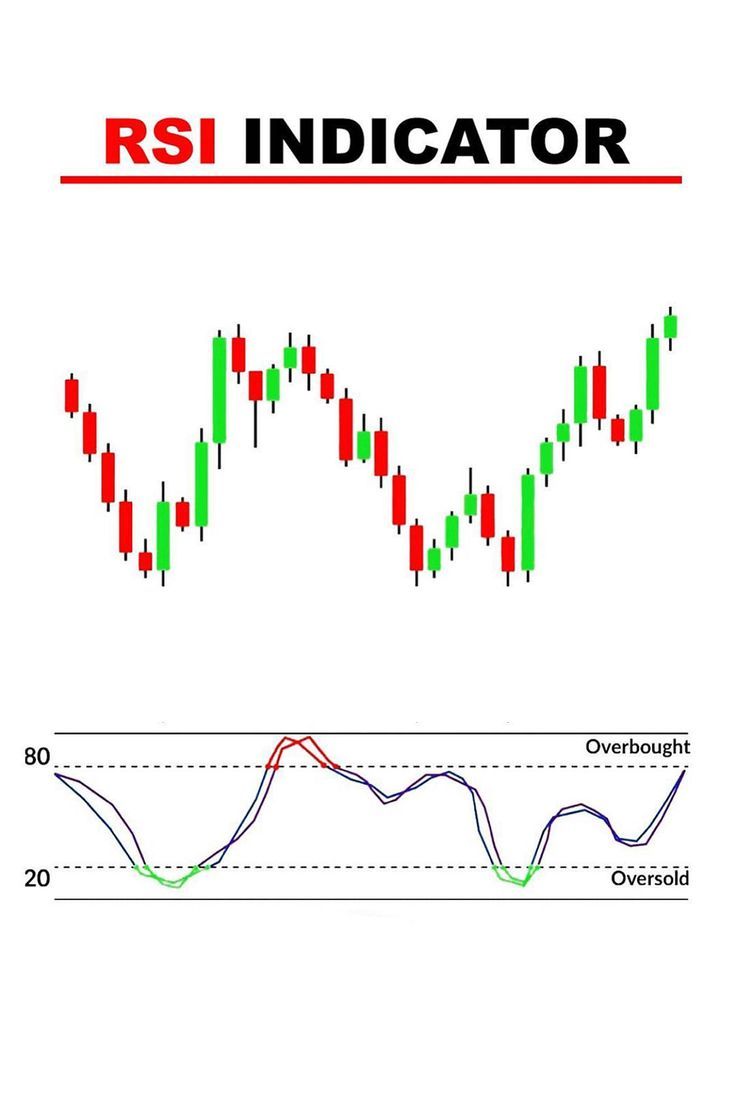
The Relative Strength Index (RSI) developed by J. Welles Wilder is a momentum oscillator that measures the speed of recent price movements to identify overbought and oversold conditions in the market.
RSI is measured by calculating the speed and change of price movements. First, find the relative strength of an asset and then add 1. After that, you divide 100 from the result and then subtract the final figure by 100.
When RSI rises above 70, it typically indicates an overbought market, while readings below 30 suggest oversold conditions. Traders also watch for RSI divergence as a strong clue of potential reversals, and a cross of the centerline at 50 often signals a shift in momentum.
RSI is highly reliable for spotting reversals and works across all markets, but one limitation is that it can remain overbought or oversold during strong trends, requiring traders to use it alongside other indicators for confirmation.
Stochastic Oscillator
The Stochastic Oscillator is a momentum indicator that compares the current price of a stock to its price range over a selected period. Developed by George Lane in the 1950s, it is an indicator that shows the location of the close relative to the high-low range over a certain period, typically a 14-day period.
This oscillator always moves between 0 and 100. Over 80 indicates the stock is likely overbought (too high, might drop soon). Under 20 means the stock is likely "oversold" (too low, might bounce up). Traders don't just look at the numbers, but also look at changes in the oscillator to spot when momentum is shifting.
The indicator has two flowing lines known as %K and %D, where the %K line is the current actual oscillator value, and the %D line is the 3‑day average of the %K value. These lines help traders to predict potential trend reversals and determine overbought and oversold levels at 80 and 20, respectively. When these two lines cross, it's often a sign that momentum is flipping, which could mean a reversal is coming.
Day traders make the most of the potential of the Stochastic Oscillator, mostly when a financial asset is trending or when there is some volatility. Like most oscillators, it is relatively difficult to use in ranging markets. The stochastic oscillator is just one tool traders use to time entries and exits. It's not perfect, but when combined with other indicators, it helps spot when a trend might be about to change.
One way of using the indicator is to buy when it gets extremely oversold and then sell when it gets extremely overbought. You can also use it to find divergences and even reversals.
Commodity Channel Index (CCI)
The Commodity Channel Index (CCI) is a momentum-based indicator that identifies price extremes relative to an average price level. Developed by Donald Lambert in the 1970s for the commodity markets, it is now widely used across all asset classes, including stocks and bonds.
In day trading, common settings are 14 or 20 periods, with signals generated when the CCI moves above +100 to indicate strong upward momentum or below -100 to show strong downward momentum. Traders also watch for divergence between the CCI and price action as a clue for potential reversals.
The strength of the CCI lies in its ability to anticipate breakouts and highlight overbought or oversold conditions, though it is more volatile than the RSI. Essentially, the CCI measures how far the current price is from its average, with elevated readings suggesting the price is trading well above its typical range.
Moving Average Convergence Divergence
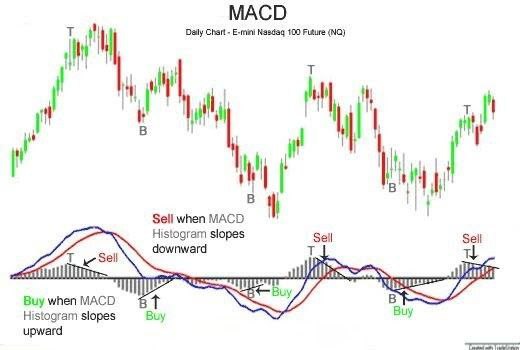
The Moving Average Convergence Divergence (MACD) is a popular trading indicator that measures the difference between two moving averages to reveal momentum and trend direction.
In day trading, the default settings of 12, 26, and 9 work well, producing signals such as the MACD line crossing the signal line, zero‑line crosses, histogram expansion or contraction, and divergence between price and the indicator. The MACD is especially useful for confirming trends and tends to give fewer false signals than the stochastic oscillator, though it does lag more than other tools.
The MACD works by subtracting a longer moving average (typically 26) from a shorter one (usually 12), and then smoothing the result with a 9‑period average. On a chart, this creates two flowing lines and a neutral zero level.
Traders use MACD in several ways: reversals are spotted when the two lines make a bullish or bearish crossover, divergences occur when price moves in one direction while the MACD trends in another, and trend‑following setups emerge when both lines continue upward or downward together.
Overall, MACD is a versatile indicator that helps traders identify momentum shifts, reversals, and trend strength in day trading.
Money Flow Index
Another oscillator commonly used by traders is the Money Flow Index (MFI). This oscillator typically measures the flow of money in and out of a financial asset by analyzing both price movements and trading volume.
It uses the 0 to 100 scale, which helps traders identify potential reversals when readings reach extreme levels or diverge from price action. If the MFI goes above 80, the stock is overbought, but if it drops below 20, it indicates the stock is oversold. If the MFI diverges (moves differently) from the price, it's often a clue that a trend reversal is coming. Traders also watch for dips below 40 in an uptrend or rallies above 60 in a downtrend to time entries and exits.
The Money Flow Index (MFI) is basically a tool that mixes price and trading volume to show whether money is rushing into a stock or rushing out. It's smarter than indicators that only look at price because it also asks, "How many people are actually trading this?"
Money flow is calculated by finding the typical price by averaging the high, low, and close for the day. Then check if the price goes up compared to yesterday. If yes, money flowed in. If it went down, money flowed out. Multiply that typical price by the trading volume to see how much money actually moved. Then keep track of all the "money in" and "money out" over 14 periods, add them up, compare the totals, and scale them between 0 and 100.
Traders typically combine the Money Flow Index oscillator with RSI for better results. Avoid them in strong, clean trending markets; they'll stay overbought/oversold for long periods.
How to Read Oscillator Signals
Reading oscillator signals is all about understanding how momentum interacts with price.
- Confirm Overbought/Oversold zones: When an oscillator moves into the overbought zone, it suggests the market may reverse downward, while oversold levels hint at a possible upward reversal. However, these signals don't mean you should jump in immediately; confirmation is key before acting.
- Check for Divergence: Divergence is one of the most powerful clues: regular divergence, such as price making higher highs while the oscillator makes lower highs, often signals a reversal, while hidden divergence, like price forming higher lows as the oscillator makes lower lows, points to trend continuation.
- Look out for Centerline: Centerline crossovers also matter, with readings above the centerline showing bullish momentum and below it showing bearish momentum, making them essential for trend-following strategies.
- Momentum Confirmation: Momentum confirmation adds another layer; if both price and the oscillator rise together, the trend is strong, but if the oscillator falls while price rises, momentum is weakening.
Finally, always interpret signals in context: in a strong trend, an overbought oscillator may simply confirm continuation, while in a weak trend, the same overbought reading could signal an impending reversal.
Conclusion
Oscillators are essential tools for day traders looking to understand momentum, spot reversals early, and avoid emotional decisions. While indicators like RSI, MACD, and Stochastic provide valuable insights, they should always be used together with price action, support/resistance, and trend structure.
Learning how oscillators work, and how to read their signals with confidence, can improve your timing, accuracy, and profitability. Master them, and your understanding of the market becomes sharper and more reliable.
Related Read: How Much Money Do You Need to Start Day Trading in 2025?
Sources
- Investopedia: Stochastic Oscillator: What It Is, How It Works, How to Calculate
- Investopedia: Money Flow Index (MFI): Definition and Uses
- Investopedia: Understanding Oscillators: A Guide to Identifying Market Trends
Frequently Asked Questions
Can oscillators be used in trending markets?
Yes. But interpret overbought/oversold readings differently. In strong trends, oscillators can stay extreme; use them for pullback entries or combine with trend confirmation (e.g., MACD or VWAP).
Which oscillator is best for crypto day trading?
No single "best" oscillator. RSI and Stochastic are popular for short-term setups; MFI adds volume context, which is helpful in crypto's liquidity-sensitive moves.
How do I reduce false signals from oscillators?
Filter signals with price structure (support/resistance), volume confirmation, a higher timeframe trend, or combine two complementary oscillators (e.g., RSI + MACD).
How should I set stop losses when trading oscillator signals?
Place stops beyond nearby structure (recent swing high/low, support/resistance) or use ATR (Average True Range) multiples to reflect intraday volatility.
How often should I update oscillator settings?
Review settings monthly or after major market regime changes. If volatility increases, shorten lookbacks; if volatility falls, lengthen them.
Follow Us On Social Media